Basic Usage of the plantuml
package
Vignette Author
2023-01-27
Source:vignettes/BasicUsage.Rmd
BasicUsage.RmdOverview
This package provides the functionality to create UML graphs using the PlantUML language.
Installation of plantuml binary
The package does not come with the plantuml binary, which needs to be installed as well. repeated calling of this function updates the binary.
Plotting Plantuml graphics
Plotplantuml Object
Now we plot in in a device using vector format (svg) as intermediate format, which is the default
plot(
  x = x
)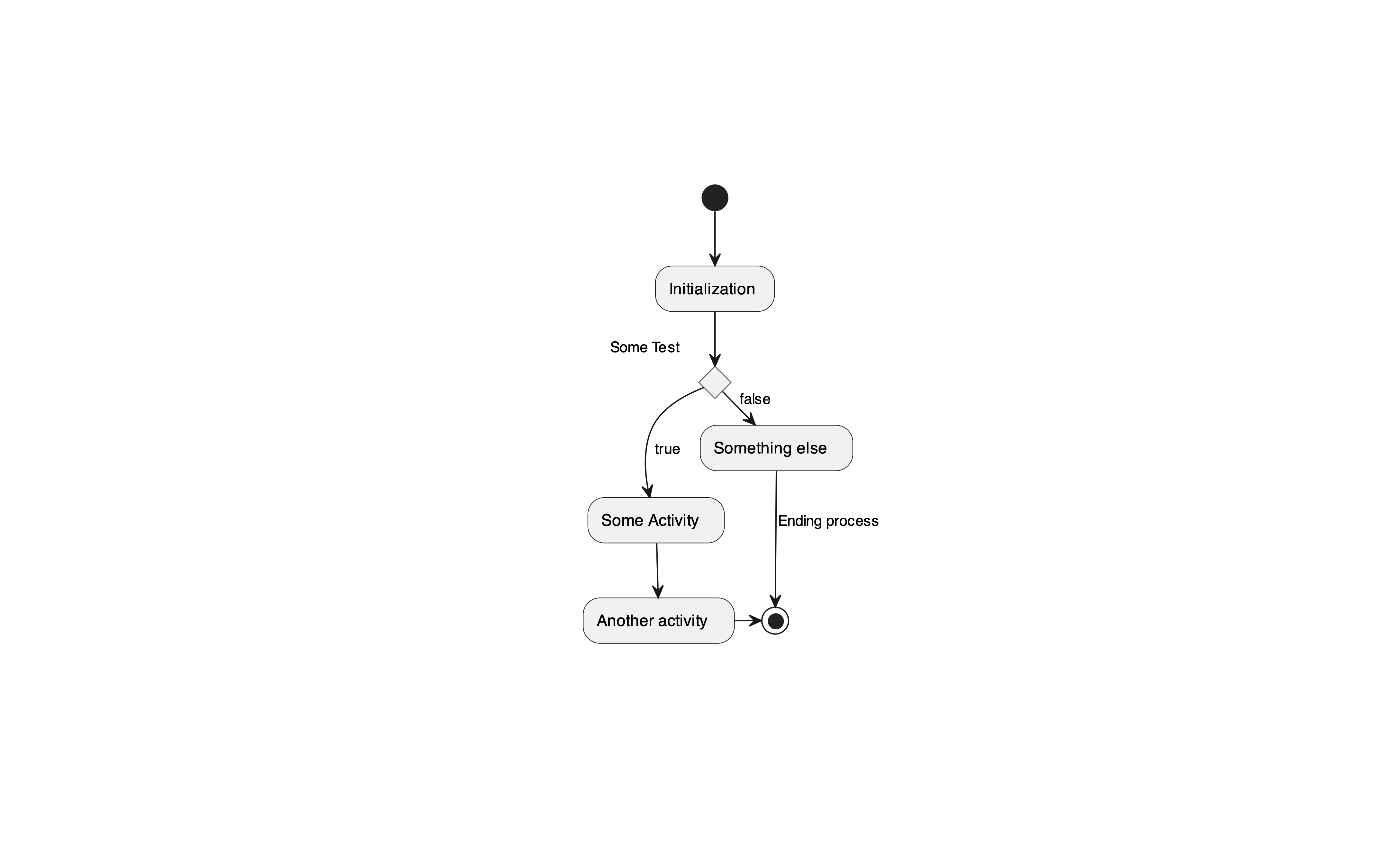
#> [1] "/var/folders/50/wcr5bjwn75q595n6x82gxj280000gq/T//Rtmp8gUtga/plantuml.91847cb37a3e.svg"Usage of the local server
The default server used is the offocial plantuml web server at http://www.plantuml.com/plantuml/. If yo weant to cretae the graphas locally, you have to
- Make sure that the plantuml file has been installed
- set the plantuml options to point to the local plantuml picoweb server
- start the plantuml picoweb server
- create the graphs, and
- when done, stop the server.
I will demonstrate this in a small example:
# 1. Make sure that the plantuml file has been installed.
# The easiest is to use the supplied command

plantuml_update()

# 2. set the plantuml options to point to the local plantuml picoweb server

server_set("local")

# 3. start the plantuml picoweb server

server_start()
Now the following graph is created locally
plot(
  x = x
)
Finally, you should stop the server:
To reset the plantuml options to use the default web server, do
server_set("remote")